---
breadcrumbs:
- - /developers
- For Developers
- - /developers/design-documents
- Design Documents
- - /developers/design-documents/chromium-graphics
- Chromium Graphics // Chrome GPU
page_name: debugging-with-nsight
title: Debugging with Nsight
---
As of the latest version of NVIDIA's Nsight (4.0 I believe), it is able to
attach to chrome's GPU process and let us debug/profile low level D3D and OpenGL
commands. It's also very useful for viewing the results of each draw call
without having to write additional application code to display intermediate
buffers.
Here is what's needed to get it working:
1. [Nsight
4.0](https://developer.nvidia.com/nsight-visual-studio-edition-downloads),
Visual Studio and an NVIDIA GPU are required. There is an Eclipse
version of Nsight but it has not been tested.
2. Open any project in Visual Studio (just needs to be something to
"run"), right click the startup project and select Nsight User
Properties.
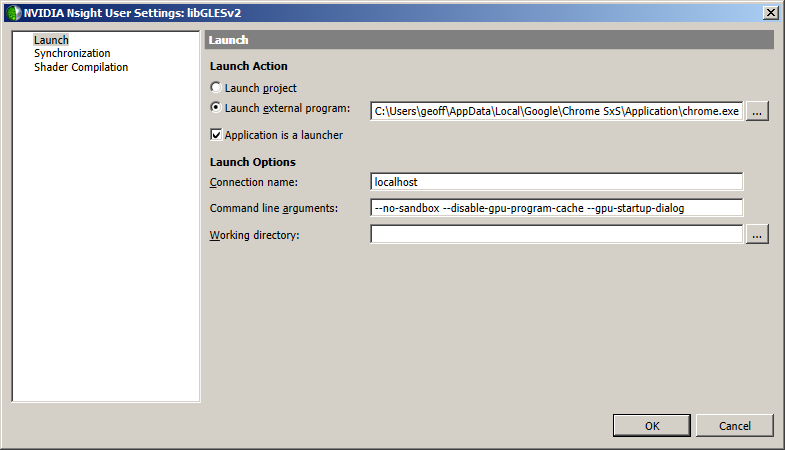
3. Set the radio box to "Launch external program", check "Application
is launcher" (this is the new feature as of 4.0) and set the command
line arguments to at least --no-sandbox --disable-gpu-watchdog and
--gpu-startup-dialog. --disable-gpu-program-cache is optional; if
you use it, you're able to step through the shader source lines,
otherwise only the disassembly is available.
 4. From the NSIGHT menu in Visual Studio, select "Start Graphics
Debugging". Wait until the gpu startup dialog shows up and connect
to it.
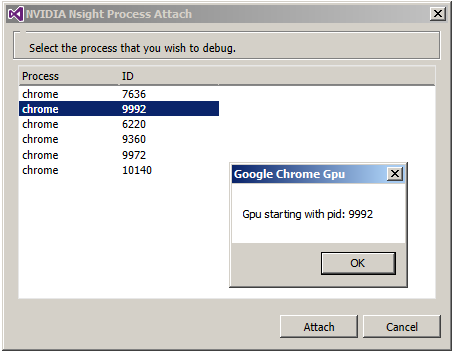
4. From the NSIGHT menu in Visual Studio, select "Start Graphics
Debugging". Wait until the gpu startup dialog shows up and connect
to it.
 5. Navigate to any page you wish to debug. The Nsight HUD doesn't seem
to be interactive with chrome though.
6. When you want to debug a frame, go to the NSIGHT menu in Visual
Studio and select "Pause and Capture Frame".
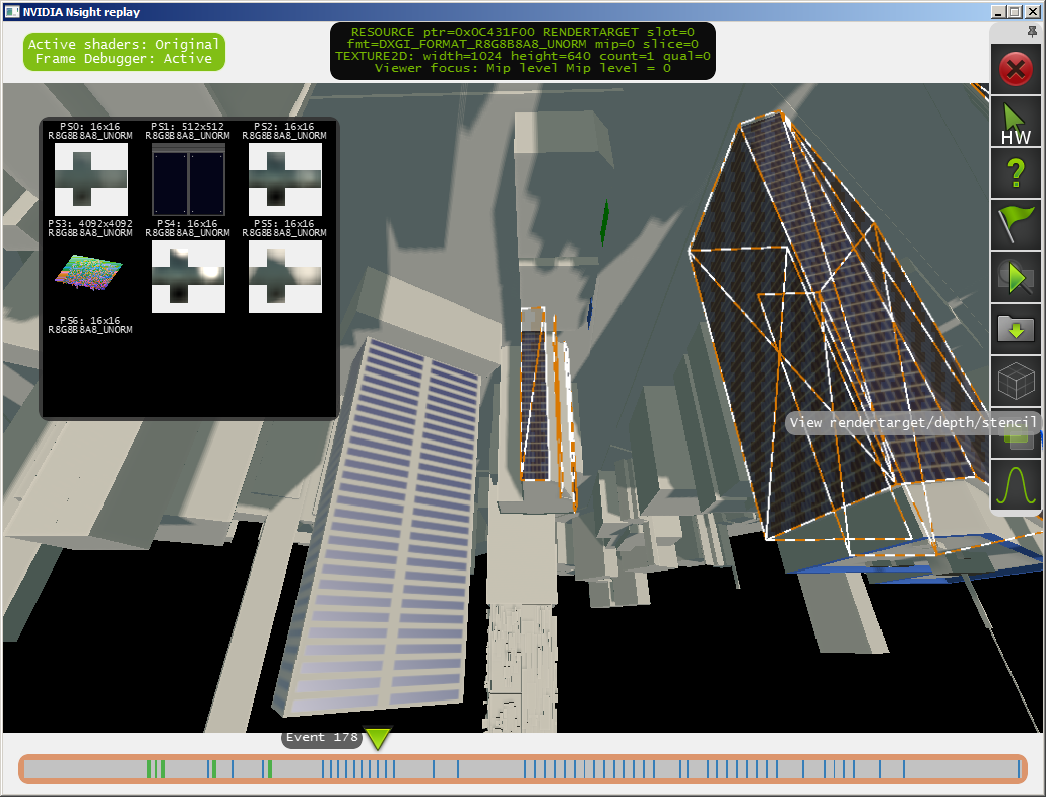
7. Nsight will open a few overlays on top of chrome that let you step
through the frame (check the taskbar, sometimes they appear behind
chrome).
5. Navigate to any page you wish to debug. The Nsight HUD doesn't seem
to be interactive with chrome though.
6. When you want to debug a frame, go to the NSIGHT menu in Visual
Studio and select "Pause and Capture Frame".
7. Nsight will open a few overlays on top of chrome that let you step
through the frame (check the taskbar, sometimes they appear behind
chrome).
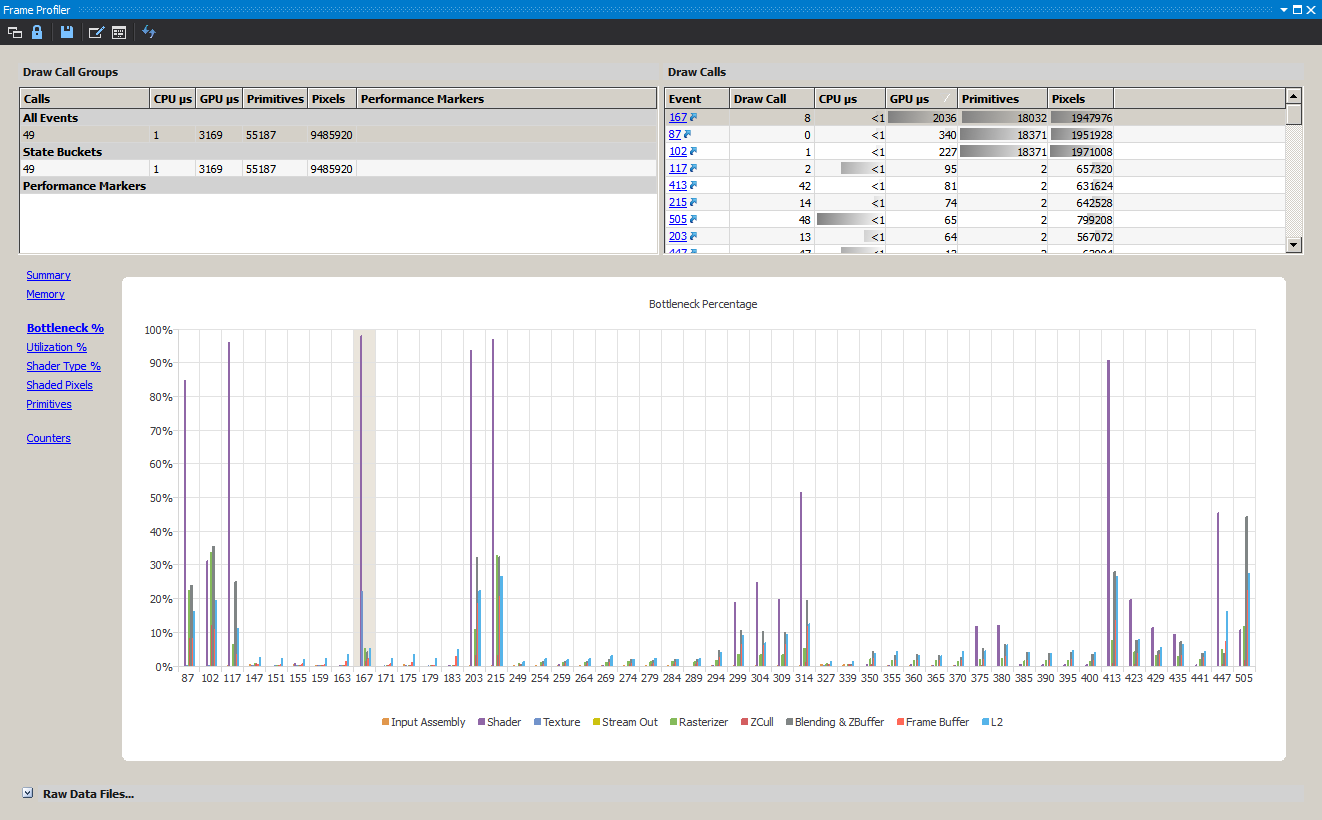
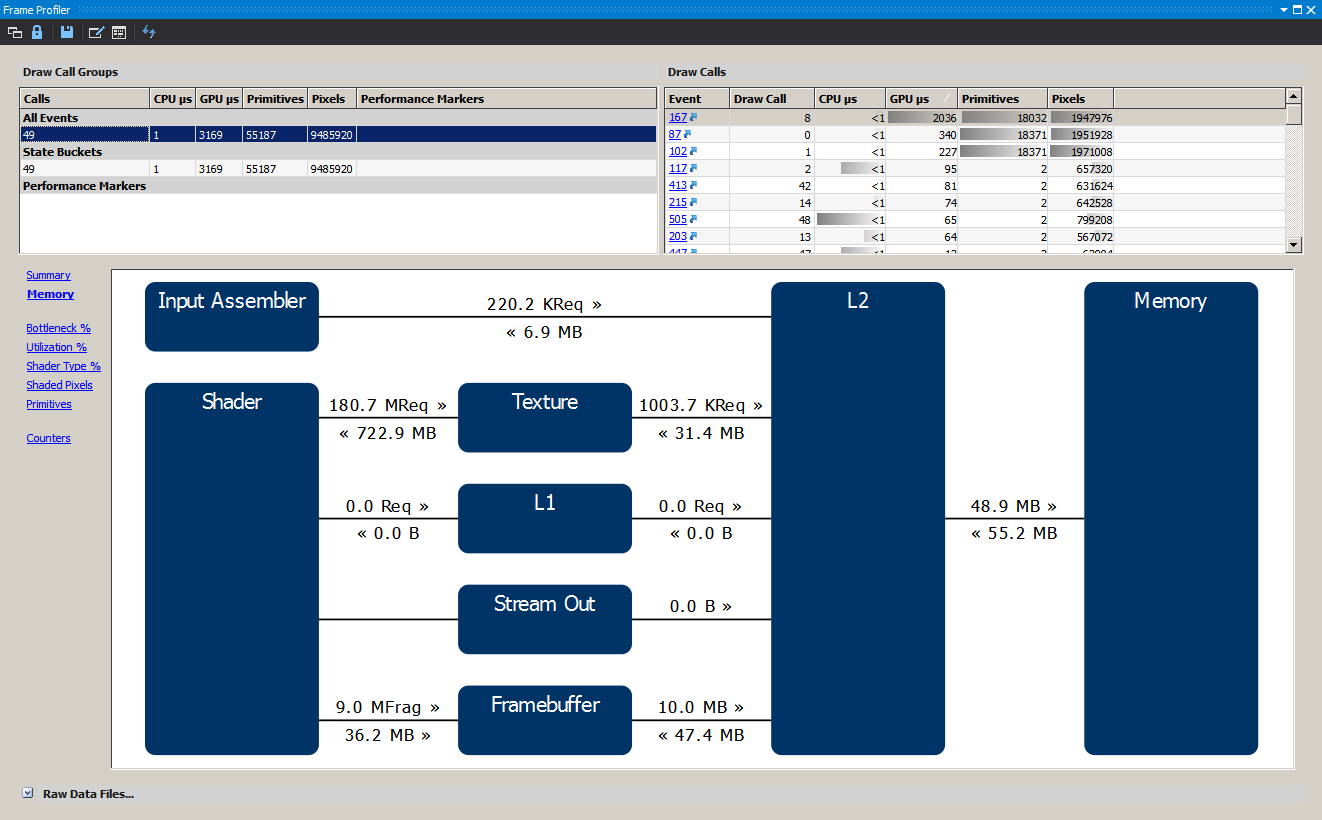
 8. It will also open some new windows in Visual Studio for viewing the
current D3D/GL state and allocated GPU resources, stepping through
the shaders for debugging (recently caught a HLSL shader
optimization bug this way), profiling the CPU/GPU speed of each call
and finding out what kind of bottlenecks we're hitting (input
assembly, pixel/vertex shader, texture fetch, blend, etc).
8. It will also open some new windows in Visual Studio for viewing the
current D3D/GL state and allocated GPU resources, stepping through
the shaders for debugging (recently caught a HLSL shader
optimization bug this way), profiling the CPU/GPU speed of each call
and finding out what kind of bottlenecks we're hitting (input
assembly, pixel/vertex shader, texture fetch, blend, etc).